Modeling Cycling Performance
Special Topics in Sports Engineering at Delft Technical University
Project Overview
This project was completed as part of the Sports Engineering MSc program during an intensive two-week residential course in Delft, focused on cycling performance analysis and modeling. The central challenge of the course was to develop a predictive performance model for a real athlete and validate it against on-track testing at the Alkmaar Velodrome.
The task required predicting two lap times and a final coast-down distance for a selected rider. The core difficulty lay in integrating multiple interacting systems—physiological capacity, aerodynamics, rolling resistance, and track dynamics—into a single coherent model capable of representing real-world performance.
The objective of the project was not only to achieve numerical accuracy, but also to understand how sensitive cycling performance predictions are to modeling assumptions and parameter selection.
Physiological Characterization
The first stage of the project focused on building a rider-specific physiological model. We conducted VO₂max and Wingate tests to quantify mechanical power output and distinguish between aerobic and anaerobic contributions.
From these tests, we:
Derived critical power and an aerobic asymptote
Used the shape of the Wingate power curve to estimate anaerobic capacity, calculated as the area above the asymptote
Estimated aerobic capacity from the remaining area under the curve
This process produced a personalized power–duration relationship, capturing both the rider’s peak power output and their ability to sustain power over time. The resulting curve formed the energetic foundation of the performance simulation.
Mechanical Resistance Modeling
The next step was to characterize the mechanical resistances acting on the rider. Frontal area was estimated using image-based pixel analysis, and a series of coast-down and power-meter tests were performed across different riding postures and tire pressures.
While these experiments produced estimates of drag coefficient (Cd) and rolling resistance (Crr), the results did not behave consistently and failed to align with published values. Given the short time frame of the course and the importance of model stability, a design decision was made to replace the experimental estimates with validated literature values for Cd and Crr in the final simulation.
This decision highlighted an important modeling trade-off between experimental specificity and parameter reliability.
Track Simulation and Performance Modeling
With the physiological and mechanical inputs defined, a full track simulation was constructed to model two laps and a coast-down at the velodrome.
Key features of the simulation included:
A 10 Hz sampled Wingate power curve to drive rider propulsion
Literature-based drag and rolling resistance coefficients
A segmented track model incorporating straight sections and cornering speed limits
The simulation logic was structured as follows:
Lap one represented an all-out acceleration phase
Lap two held the rider at the maximum speed sustainable under the power curve
The coast-down phase modeled passive deceleration due to aerodynamic drag and rolling resistance only
The model output rider velocity, position, and acceleration as functions of time.
Model Validation and Results
When compared to the real velodrome test, the predicted lap times were within 4 percent of the athlete’s measured performance. However, post-analysis revealed that this apparent accuracy resulted from an unexpected cancellation of errors.
Specifically:
Straight-line speeds were approximately 5 km/h slower in reality than predicted
Cornering speeds were approximately 5 km/h faster than the model assumed
These opposing discrepancies produced an average lap speed that closely matched the simulation, despite underlying inaccuracies. The coast-down distance, however, showed a substantial error. Faster real-world cornering speeds allowed the rider to retain velocity longer than expected, and small inaccuracies in track geometry further amplified the mismatch.
Key Insights and Learning Outcomes
This project demonstrated that cycling performance models are highly sensitive to assumptions and input values, particularly when multiple subsystems interact. Even with a detailed physiological representation and a carefully structured simulation, small inaccuracies in drag, rolling resistance, speed constraints, or geometry can produce large downstream effects.
The experience reinforced the importance of building models that are:
Specific enough to represent individual athletes
Robust enough to tolerate real-world variability and measurement uncertainty
It also highlighted that numerical accuracy alone is not a sufficient indicator of model quality—understanding why a model works or fails is equally important.
Skills Demonstrated
Cycling performance modeling
Physiological testing and power–duration analysis
Aerodynamic and rolling resistance estimation
Dynamic simulation and numerical modeling
Critical evaluation of model assumptions
Team-based problem solving under time constraints
Gaining understanding the hard way.
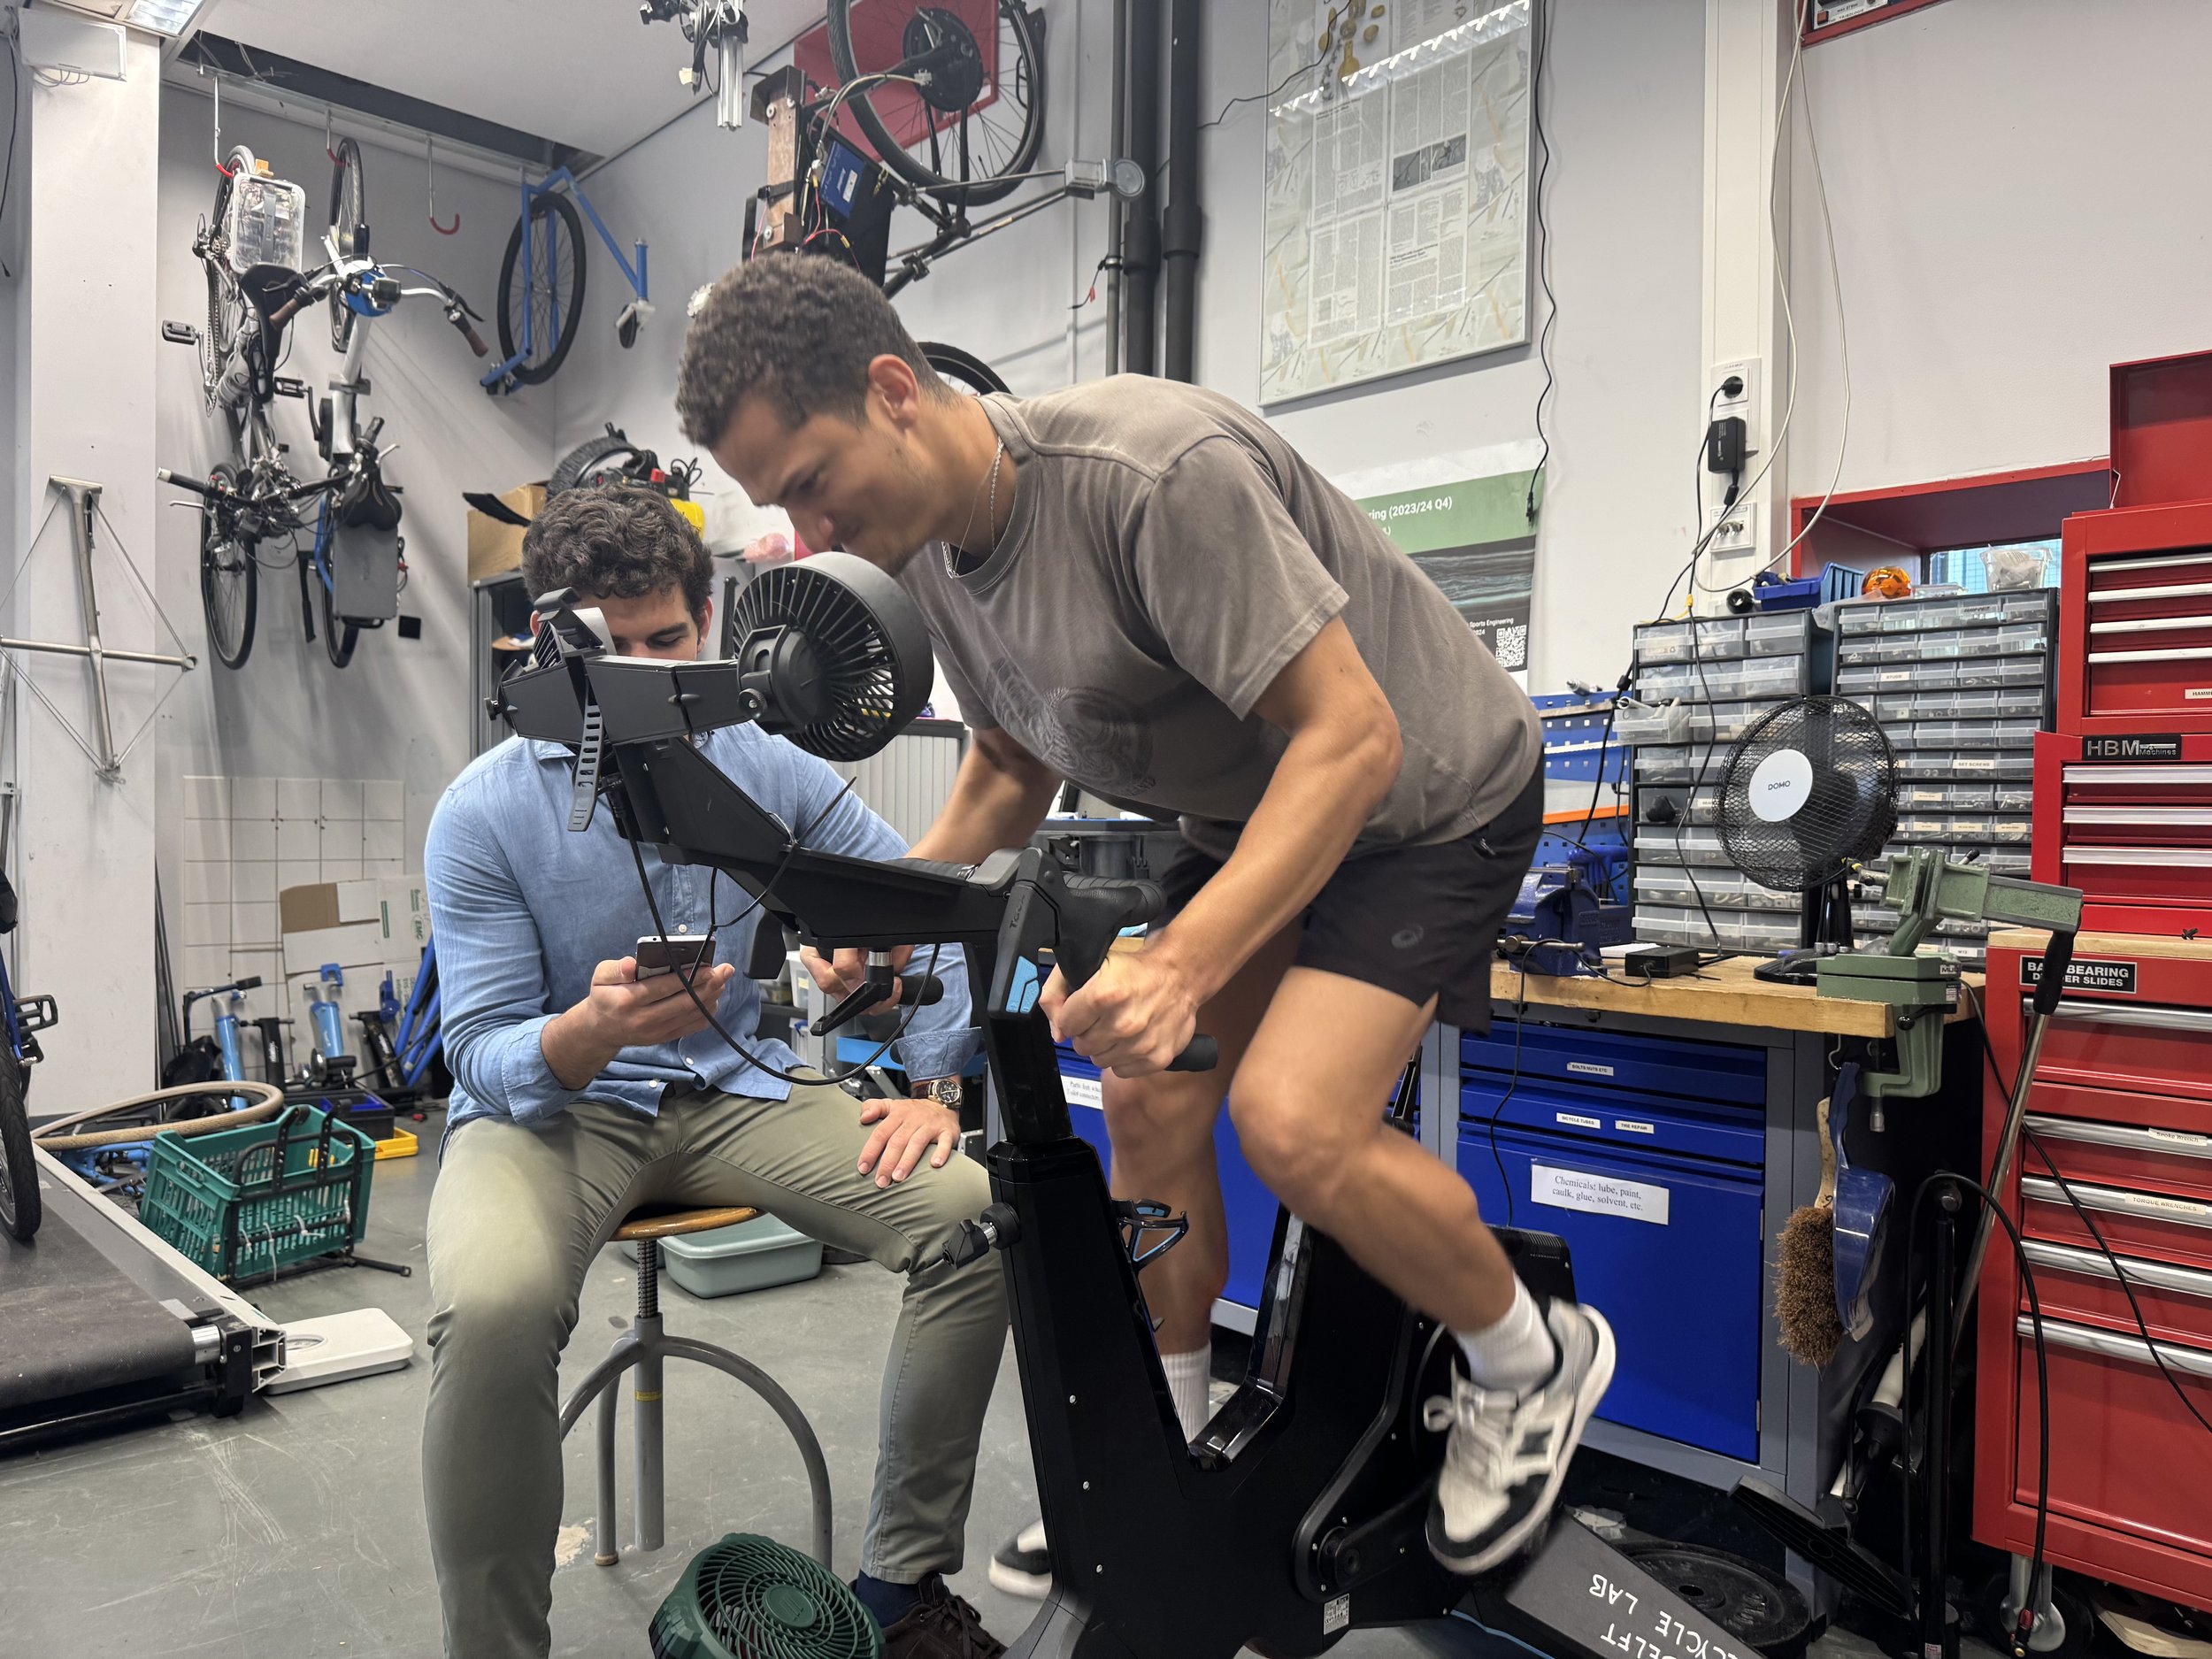
Being at a high-tech facility presented the perfect opportunity to delve deeper into the world of peak physical exertion, so I decided to try the Wingate test. My goal was to gain a firsthand understanding of what it truly means to push yourself to complete exhaustion in an all-out “anaerobic” effort. I had already experienced the VO2max test — which, let’s be honest, felt like running up an endless hill with no finish line — so I figured the Wingate might be a bit easier. Spoiler alert: I was wrong. The Wingate test is a brutal, pedal-to-the-metal sprint that leaves no room for mercy or second chances and left me out of commission for 30 minutes afterwards.